Introduction
In this explanation, we delve into the concept of Self-Organizing Maps (SOM), a type of unsupervised neural network introduced by Teuvo Kohonen. SOMs are particularly useful for data dimensionality reduction, visualization, and clustering tasks. In the context of petroleum exploration and geophysical data analysis, SOMs support techniques where large, multidimensional datasets (e.g., 3D seismics or electrofacies attributes) need to be segmented and interpreted efficiently, without manual labeling.
This detailed narrative not only explains the basic principles and mathematics behind SOMs, but also explains the role the method plays in modern machine learning applications within geoscience. We will discuss the architecture, key mathematical formulations, assumptions, and the iterative process that allows SOMs to discover patterns hidden within complex datasets.
The Basics of Self-Organizing Maps
A Self-Organizing Map is an unsupervised learning algorithm that projects high-dimensional input data onto a lower-dimensional (usually two-dimensional) grid of neurons. Each neuron in the grid is characterized by a weight vector of the same dimension as the input data. During training, these neurons compete to best represent the input data. The neuron whose weight vector is closest (by a chosen distance metric, typically the Euclidean distance) to the given input is called the Best Matching Unit (BMU).
The idea is that, after sufficient training iterations, the grid will represent a topology-preserving mapping where similar data points appear close together on the grid. This is extremely valuable for visualizing multi-dimensional relationships, which is particularly useful in seismically derived attribute classification or facies segmentation in oil and gas exploration.
Key Assumption: It is assumed the input data possess inherent topological structure that can be preserved in a 2D mapping.
Mathematical Formulation and Learning Process
The SOM algorithm follows an iterative learning process. Below is a summary of the key mathematical steps involved:
-
Initialization: Weight vectors
wifor each neuroniare initialized randomly or by sampling from the input distribution. Eachwihas the same dimensiondas the input vectorx. -
Finding the Best Matching Unit (BMU): For a given input vector
x, the BMU is determined by minimizing the Euclidean distance:
Here, the notationBMU = argmini||x-wi||||x-wi||indicates the Euclidean norm. This process is repeated for each input sample. -
Neighborhood Function: Once the BMU is identified, a neighborhood around the BMU is defined. Neurons within this neighborhood will have their weights updated. A common choice for the neighborhood function is the Gaussian:
wherehci(t) = exp(-||rc-ri||2/(2σ(t)2))rcandriare the positions of the BMU and neuronion the grid, andσ(t)is the neighborhood radius which decreases with timet. -
Weight Update: The weight vector of each neuron is updated according to the learning rate
α(t)and the neighborhood function:
Over many iterations, this rule ensures that neurons in the vicinity of the BMU shift their weight vectors closer to the input vector.wi(t + 1) = wi(t)+α(t)·hci(t)·[x-wi(t)] -
Iteration and Convergence: The process is repeated for each input vector across many iterations. Over time, both the learning rate
α(t)and the neighborhood radiusσ(t)decrease, allowing the map to converge and reflect finer distinctions in the data.
Side Note: The gradual reduction in the learning rate and neighborhood function is critical for ensuring that the mapping stabilizes and avoids excessive oscillations or overfitting to temporal data peculiarities.
Conceptual Justifications and Assumptions
The design of Self-Organizing Maps is founded on several key assumptions and conceptual principles:
- Topology Preservation: The SOM algorithm is designed with the objective that the spatial organization of the map reflects the similarity structure of the input data. This means that if two input data points are close in the high-dimensional space, they should ideally activate neurons that are closer together on the map.
- Dimensionality Reduction: By mapping high-dimensional data onto a 2D grid, SOMs assist users in visualizing and interpreting complex, multi-variate datasets—an essential requirement in applications like seismics where data dimensions can be vast.
- Unsupervised Learning: Since SOMs work without pre-assigned labels, they are well suited to exploratory data analysis. This is particularly beneficial in geoscience where manually segmenting an entire 3D seismic volume is time-consuming and subject to human bias.
- Neighborhood Cooperation: The updating mechanism that affects not only the BMU but also its neighbors ensures that clustering is smooth and the overall map eventually forms coherent regions that represent similar data features.
These assumptions make SOMs especially applicable in contexts where data are complex and interpretation must be both rapid and reproducible.
Application of SOM in Petroleum Exploration
In petroleum exploration, large seismic volumes and attribute datasets are common. Traditionally, geoscientists would manually inspect and classify these attributes—a process that is time intensive and subjective. With SOMs, the following steps can be performed:
- Data Segmentation: SOMs can automatically segment a 3D seismic dataset into different clusters or facies. These clusters, sometimes referred to as electrofacies, represent areas with similar seismic properties. This segmentation aids geologists in identifying prospective zones for drilling.
- Objective Classification: By reducing the influence of human bias, SOM-based classification ensures that subtle variations in the data, which may be indicative of different lithologies or fluid contents, are accurately captured.
- Pattern Recognition: The map’s structure itself becomes a visual tool. When the SOM converges, geoscientists can analyze the spatial organization of clusters. Regions marked in close proximity on the SOM suggest similar geological processes and histories.
For example, in a case where seismic data reveal variations in amplitude and frequency, the SOM might map these features into distinct clusters. When calibrated with borehole data, these clusters provide reliable predictions regarding reservoir quality, fluid saturation, and trap integrity—key components in assessing the risk and potential yield of an exploration venture.
Step-by-Step Derivation Process
To further illustrate the SOM algorithm, consider the following breakdown of the weight update rule:
Begin with an input vector, x, and the weight vector for a neuron, wi. The first step is to calculate the Euclidean distance between x and wi:
||x-wi|| = sqrt((x₁-wi1)²+(x₂-wi2)²+...+(xd-wid)²)
The neuron with the smallest distance is the BMU. Once the BMU is determined, the neighborhood function hci(t) is computed to gauge the influence of this input vector on every neuron on the grid. The Gaussian function is often used here, as shown:
hci(t) = exp(-||rc-ri||²/(2σ(t)²))
Finally, the weight update equation ensures that weights are shifted towards the input vector proportional to the learning rate α(t) and the neighborhood function:
wi(t+1) = wi(t)+α(t)·hci(t)·[x-wi(t)]
Important Note: Both α(t) and σ(t) are designed to decrease over time to allow coarse global ordering initially and finer local adjustments later in the training process.
Summary and Conclusions
In summary, Self-Organizing Maps (SOMs) offer a robust method for unsupervised learning by projecting high-dimensional data onto a simpler, low-dimensional grid. The process involves:
- Initializing weight vectors for each neuron.
- Identifying the Best Matching Unit (BMU) using Euclidean distance.
- Applying a neighborhood function to determine the area of influence.
- Updating weights iteratively using a decaying learning rate and neighborhood radius.
These steps ensure that data with complex internal structures can be visualized and analyzed more intuitively. The use of SOMs in petroleum exploration provides an objective and reproducible method for classifying seismic data and identifying potential reservoir zones. Researchers and practitioners benefit from the reduced subjectivity and enhanced ability to detect subtle patterns in large, multidimensional datasets.
While SOMs are powerful, it is important to remember that they depend on critical parameters such as the choice of initialization, neighborhood function, and decaying schedules for α(t) and σ(t). Adjustments and calibrations based on preliminary data analysis and domain knowledge are crucial for optimal performance.
Ultimately, by robustly mapping the relationships within input data, SOMs become invaluable tools in exploratory data analysis. In geological applications—ranging from facies classification to delineating subtle geophysical anomalies—they provide insights that can lead to more effective decision-making in resource exploration.
Example
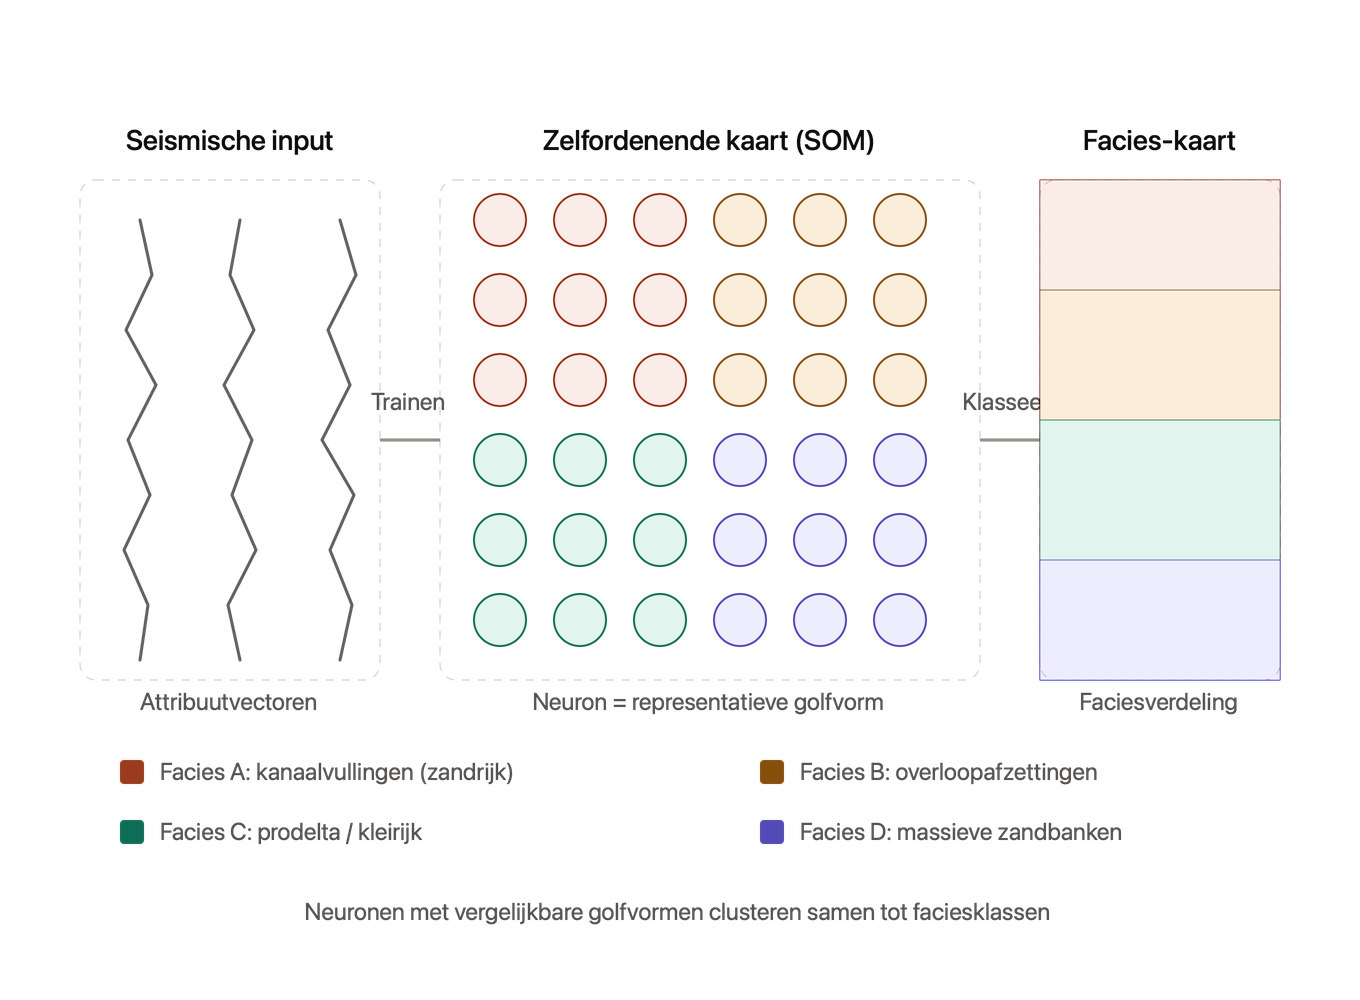
Zo werkt het in de praktijk:
- Invoer: elke seismische trace wordt omgezet in een attribuutvector (amplitude, frequentie, fase, waveform-vorm, etc.) — dit is de data die aan de SOM gevoed wordt.
- Training: de SOM is een 2D-rooster van neuronen die elk een "prototype"-golfvorm representeren. Tijdens training passen naburige neuronen zich steeds meer aan elkaar aan, waardoor vergelijkbare seismische signaturen topologisch bij elkaar komen te liggen — dat is precies wat "zelfordenend" betekent.
- Classificatie: elke trace in het dataset wordt toegewezen aan het neuron (de "winning node") waarvan de golfvorm het beste past. Doordat de kaart al geclusterd is in gebieden, ontstaat er automatisch een indeling in een klein aantal seismische faciesklassen.
- Resultaat: die klassen worden terugvertaald naar een ruimtelijke kaart of doorsnede, waarbij elke kleur een geologisch interpretabele facies voorstelt (bijv. kanaalvullingen, overloopafzettingen, prodelta-klei, zandbanken).
Closing Remarks
Through this detailed exploration of Self-Organizing Maps, we have seen that the method’s blend of mathematical rigor with intuitive visualizations is especially suited for complex exploratory tasks. Whether used to analyze seismic attributes or to help classify intricate data patterns, SOMs exemplify the power of unsupervised machine learning, enabling geoscientists and data analysts alike to predict behaviors and uncover hidden structures within their data.
We encourage further exploration of SOMs using real-world datasets to fully appreciate their capacity to reveal insights in diverse scientific and industrial applications.
The book "Applied Machine Learning: An Introduction" by Kishan Jainandunsing, PhD, provides an excellent chapter on SOMs and various mainstream clustering algorithms, including K-Means. The book is available in electronic format via Amazon.